
[vc_row][vc_column][vc_column_text]Often times a person’s lab results will come back showing all values within the normal standard reference range. There are no high or low values standing out, i.e. flagged with a big letter “H” or a big letter “L. This means the person is in great health, right? Well, not so quick.
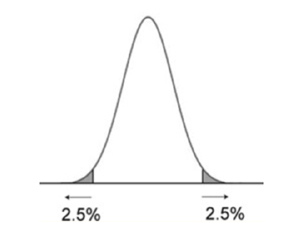 By definition, a normal standard lab reference range traditionally includes 95% of apparently healthy individuals. This means that 2.5% of the those with the lowest results are at one end while 2.5% with the highest are at the other. The so-called healthy people fall somewhere in the middle, represented by a bell curve.
Unfortunately, 95% of the population isn’t necessarily healthy. Lab ranges vary from lab to lab, state to state and country to country. With the exception of a few markers, such as cholesterol, ranges aren’t standardized. Most ranges are based on the people who come to that particular lab, rather than on research for reference data. These are the people whose doctor advised them to go to the lab to have their blood drawn. Additionally, this is the population who eats the standard American diet (SAD), are fatigued, overweight, have diabetes, cardiovascular disease, cancer, hormone imbalances, viruses, and/or bacterial infections. Healthy people tend to have lab tests run less often than sick people. Let’s think about the standard American diet. It’s the average way. Do we really want average?
The chief purpose of conventional lab reference ranges is to diagnose disease. Reference ranges are good at this, but not at evaluating health. Optimal ranges are different than standard ranges because they place priority on an optimal range of nutrients and organ function within the body. These ranges help to prevent disease, not just detect a disease or pathology after it’s happened. Many consider the absence of disease to be “health.” But this is a long way from true health.
A state of dysfunction frequently occurs before a disease state. Examples dysfunction include fatigue/low energy, digestive disorders (i.e. bloating, gas, acid reflux, constipation/diarrhea), allergies/sensitivities, lowered immunity, hormonal balances, pain/inflammation, sleep disturbances, cognitive impairment, weight changes, anxiety/depression, and the list goes on. Consider these warning signs. Often times, individuals with these types of symptoms/warning signs will have lab tests which result in normal ranges.
A classic example is that of vitamin D deficiency. Research shows that low vitamin D is linked to a plethora of concerns, i.e. anemia, asthma, cancer, cognitive decline, energy levels, depression/anxiety, inflammation, miscarriage, and IBS just to name a few. Estimates indicate that almost half of the US population is deficient, but based on the standard range level only 2.5% would be deficient. A standard range for vitamin D may be 20 ng/mL to 50 ng/mL. This level may prevent osteomalacia (softening of the bones). However, for optimized health and disease prevention, levels closer to 55 to 80 ng/mL are required.
Optimal lab ranges seek to optimize health status, not merely prevent disease. These ranges provide warning signals before disease occurs, and affords the opportunity for corrective action. An optimal range may also be called a functional range. The lab value may be higher or lower to that of conventional lab ranges.
On a side note, health insurance companies are more frequently dictating which lab markers will be covered by insurance. Healthcare providers have limited choices in which labs they can run. As a result, a small snapshot is provided rather than the big picture of a person’s health status.
Cari Verde, MS, CNS, LDN[/vc_column_text][/vc_column][/vc_row]